useR! 2022: My 'Futureverse: Profile Parallel Code' Slides


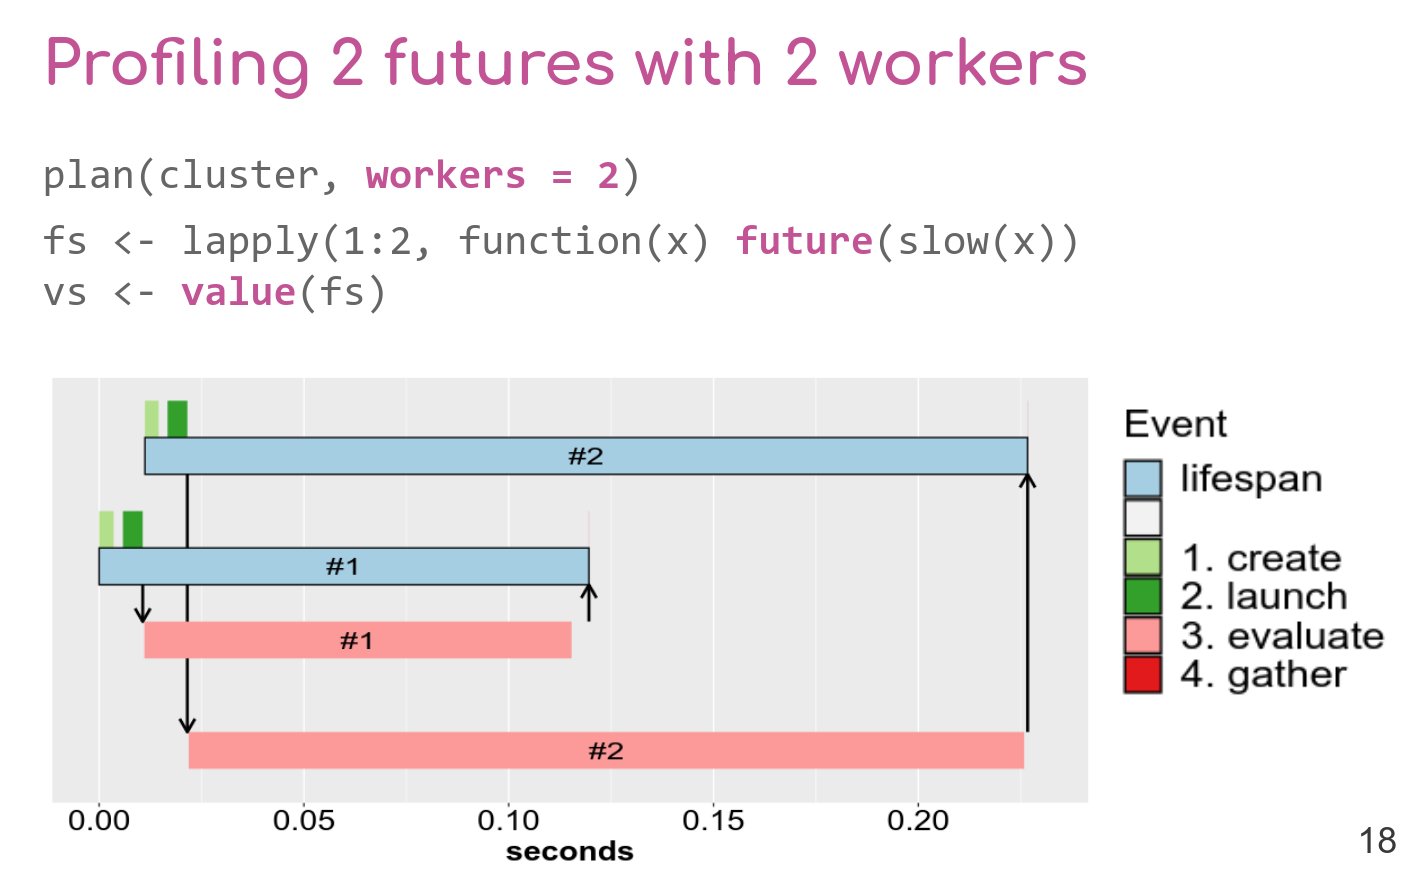
Below are the slides for my Futureverse: Profile Parallel Code talk that I presented at the useR! 2022 conference online and hosted by the Department of Biostatistics at Vanderbilt University Medical Center.
Title: Futureverse: Profile Parallel Code
Speaker: Henrik Bengtsson
Session: #21: Parallel Computing, chaired by Ilias Moutsopoulos
Slides: HTML, PDF (24 slides)
Video: official recording (27m30s long starting at 42m10s)
Abstract:
“In this presentation, I share recent enhancements that allow developers and end-users to profile R code running in parallel via the future framework. With these new, frequently requested features, we can study how and where our computational resources are used. With the help of visualization (e.g., ggplot2 and Shiny), we can identify bottlenecks in our code and parallel setup. For example, if we find that some parallel workers are more idle than expected, we can tweak settings to improve the overall CPU utilization and thereby increase the total throughput and decrease the turnaround time (latency). These new benchmarking tools work out of the box on existing code and packages that build on the future package, including future.apply, furrr, and doFuture.
The future framework, available on CRAN since 2016, has been used by hundreds of R packages and is among the top 1% of most downloaded packages. It is designed to unify and leverage common parallelization frameworks in R and to make new and existing R code faster with minimal efforts of the developer. The futureverse allows you, the developer, to stay with your favorite programming style, and end-users are free to choose the parallel backend to use (e.g., on a local machine, across multiple machines, in the cloud, or on a high-performance computing (HPC) cluster).”
I want to send out a big thank you to useR! organizers, staff, and volunteers, and everyone else who contributed to this event.
/Henrik
Links
- useR! 2022: https://user2022.r-project.org/
- futureverse website: https://www.futureverse.org/
- future package CRAN, GitHub, pkgdown